Truly intelligent facility management
Challenge
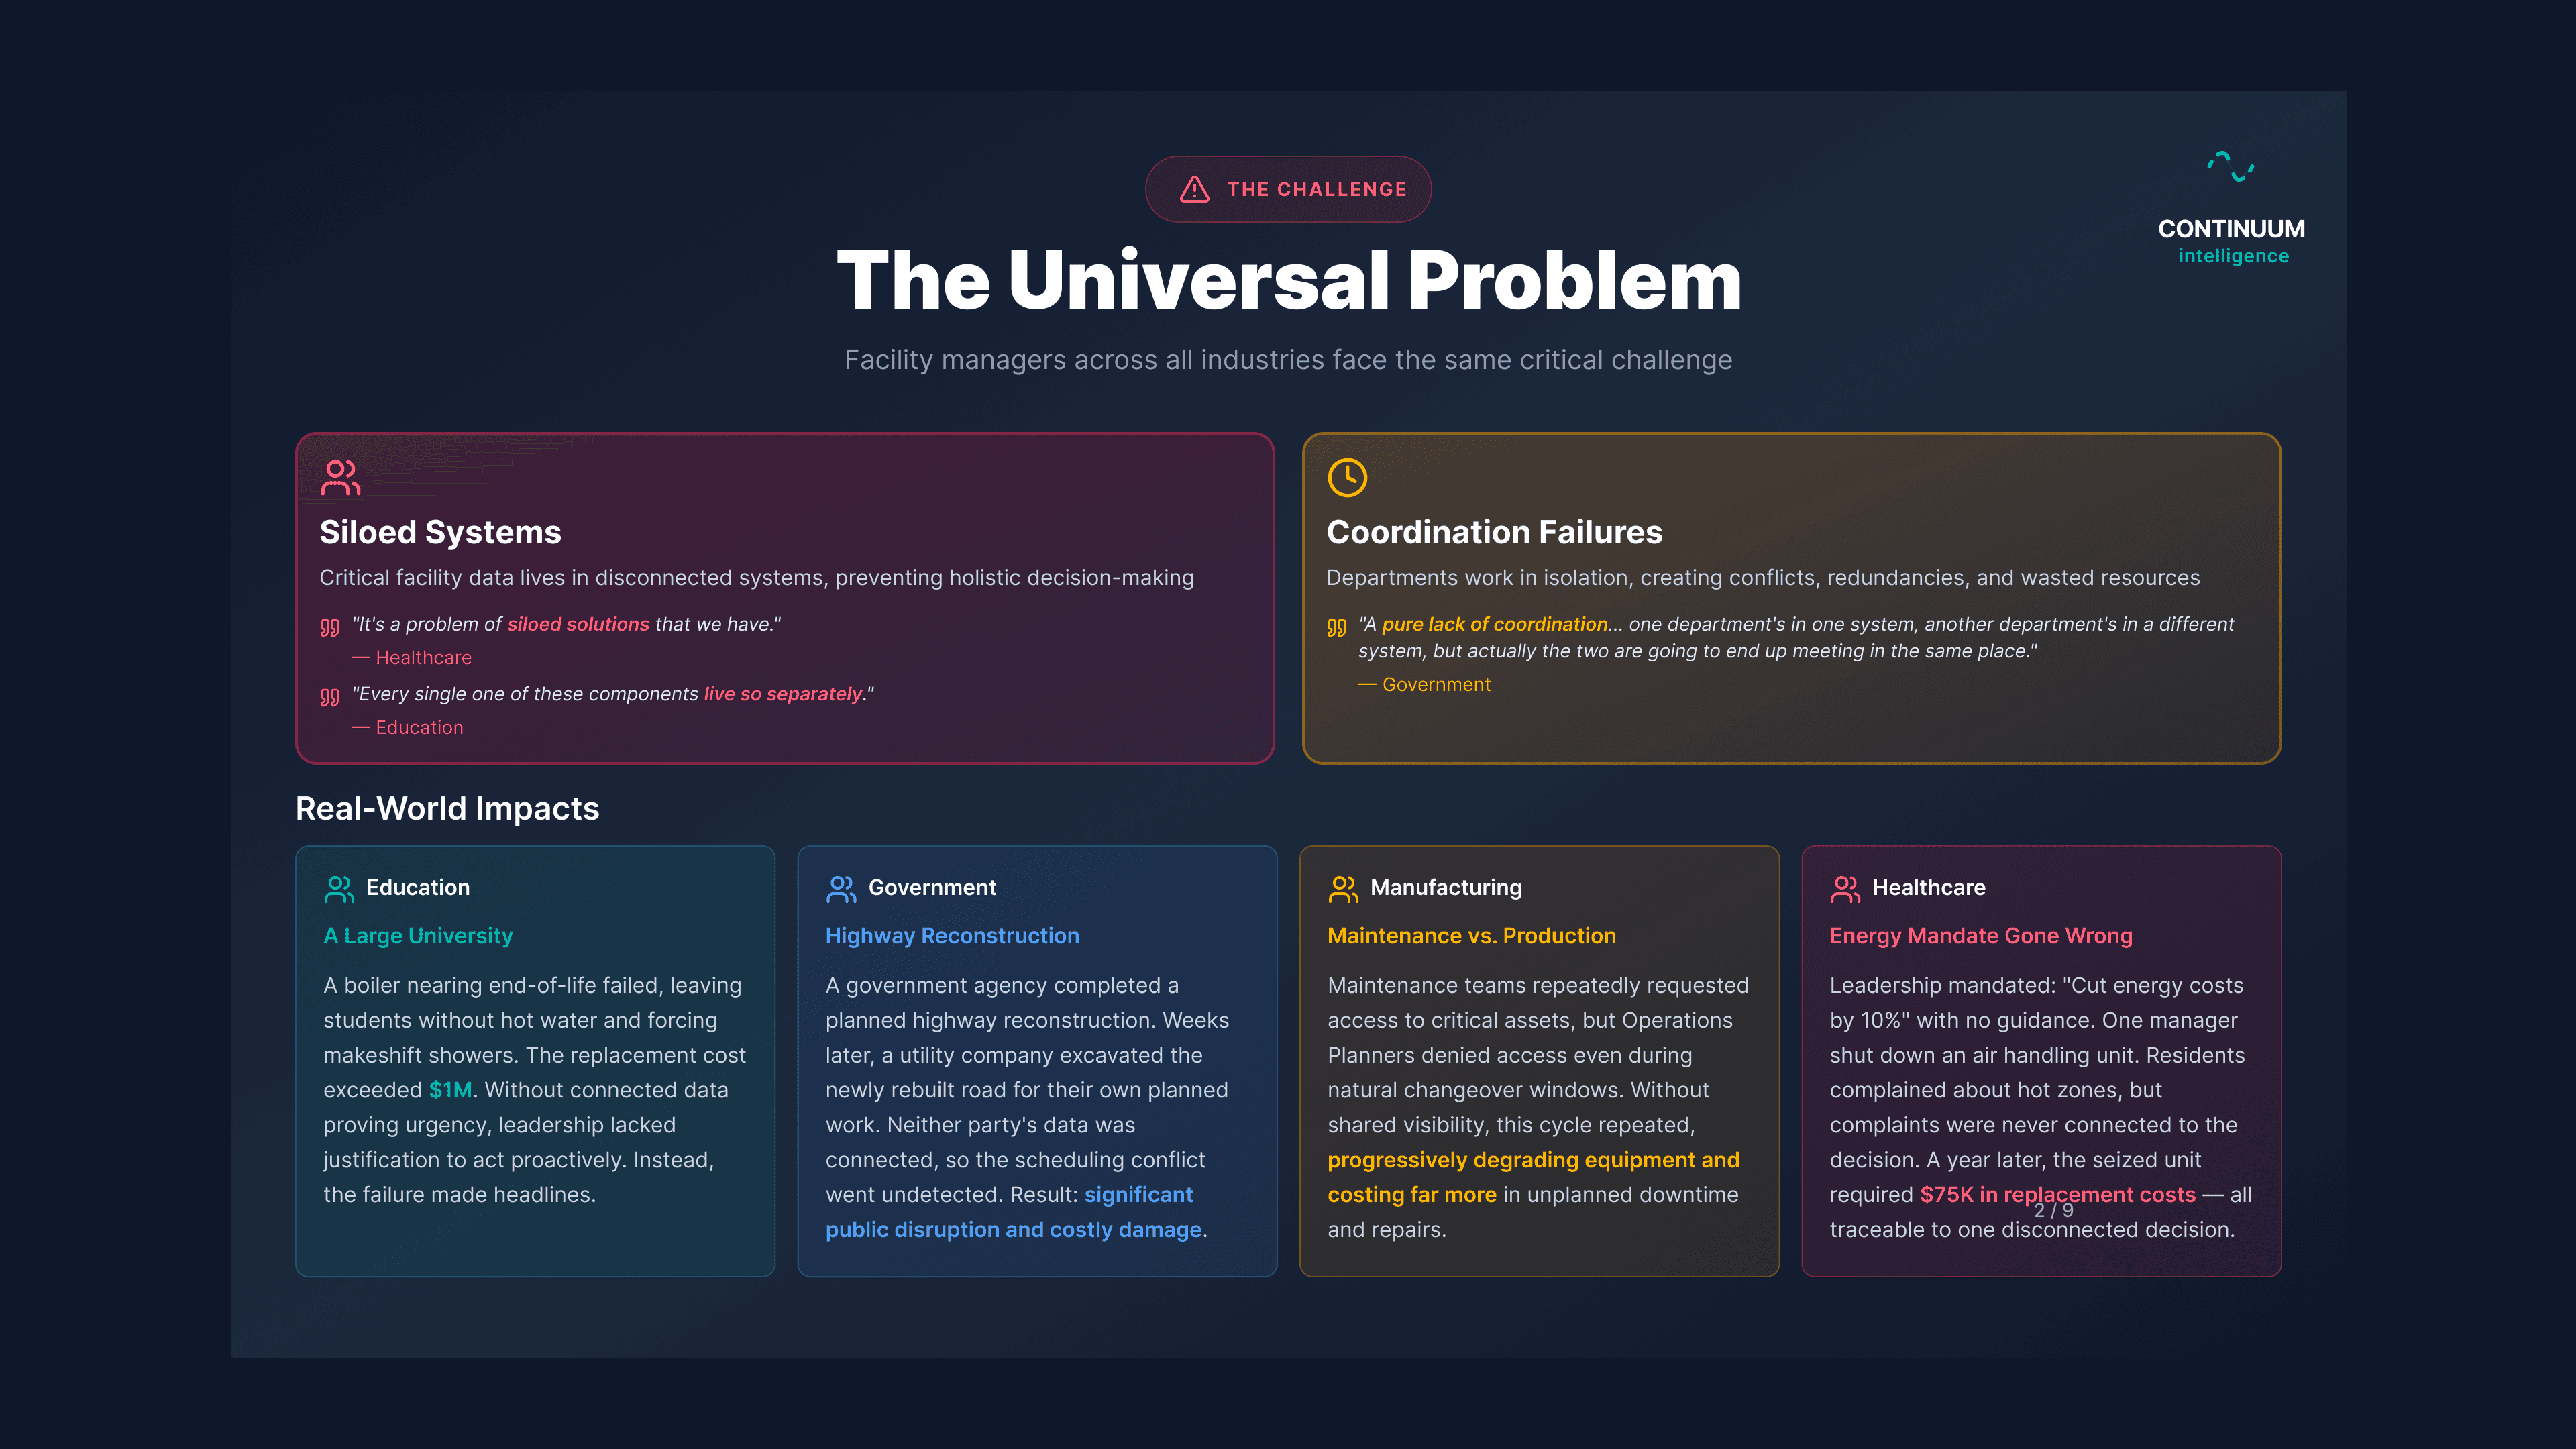
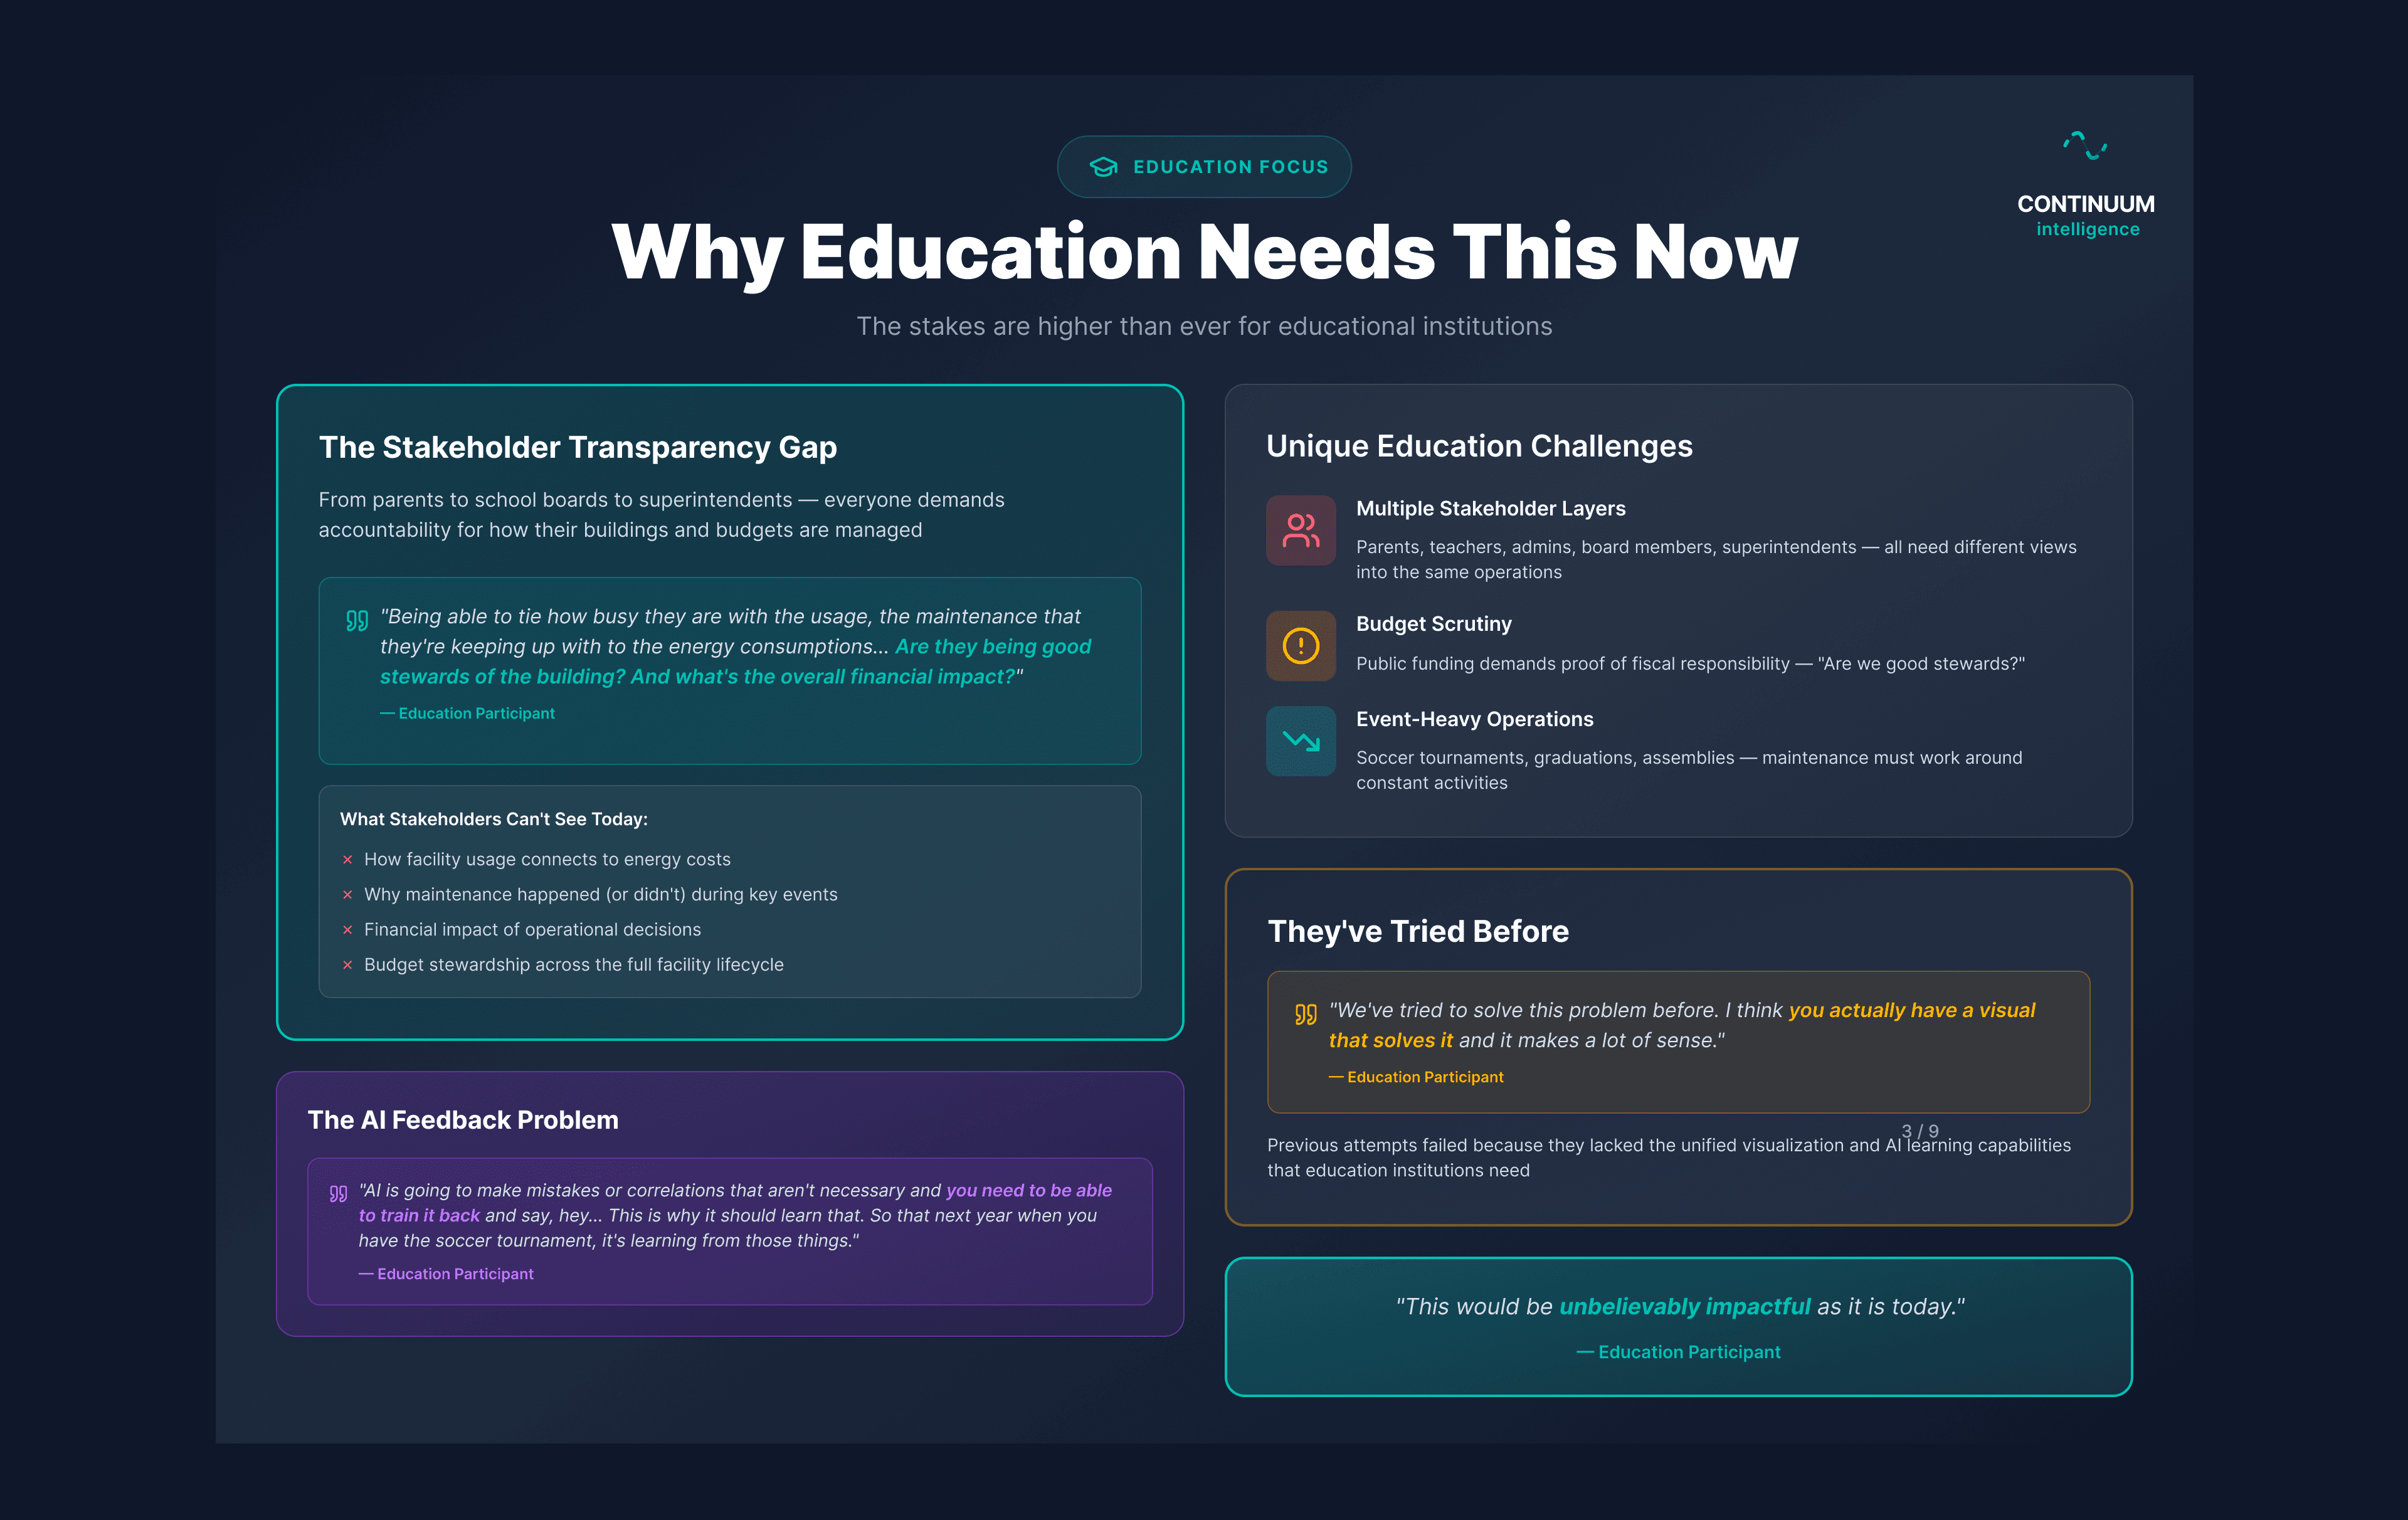
A consistent theme emerged from customer interviews, no matter the product or topic we were discussing: data scattered across disconnected systems made it nearly impossible to bring everything together and make confident decisions.
The natural solution would be a dashboard that surfaces the most important data in one place. But a dashboard can often fail to tell a coherent story. Just because you can see the most important data points doesn't mean that you can clearly understand how to act on them.
Approach
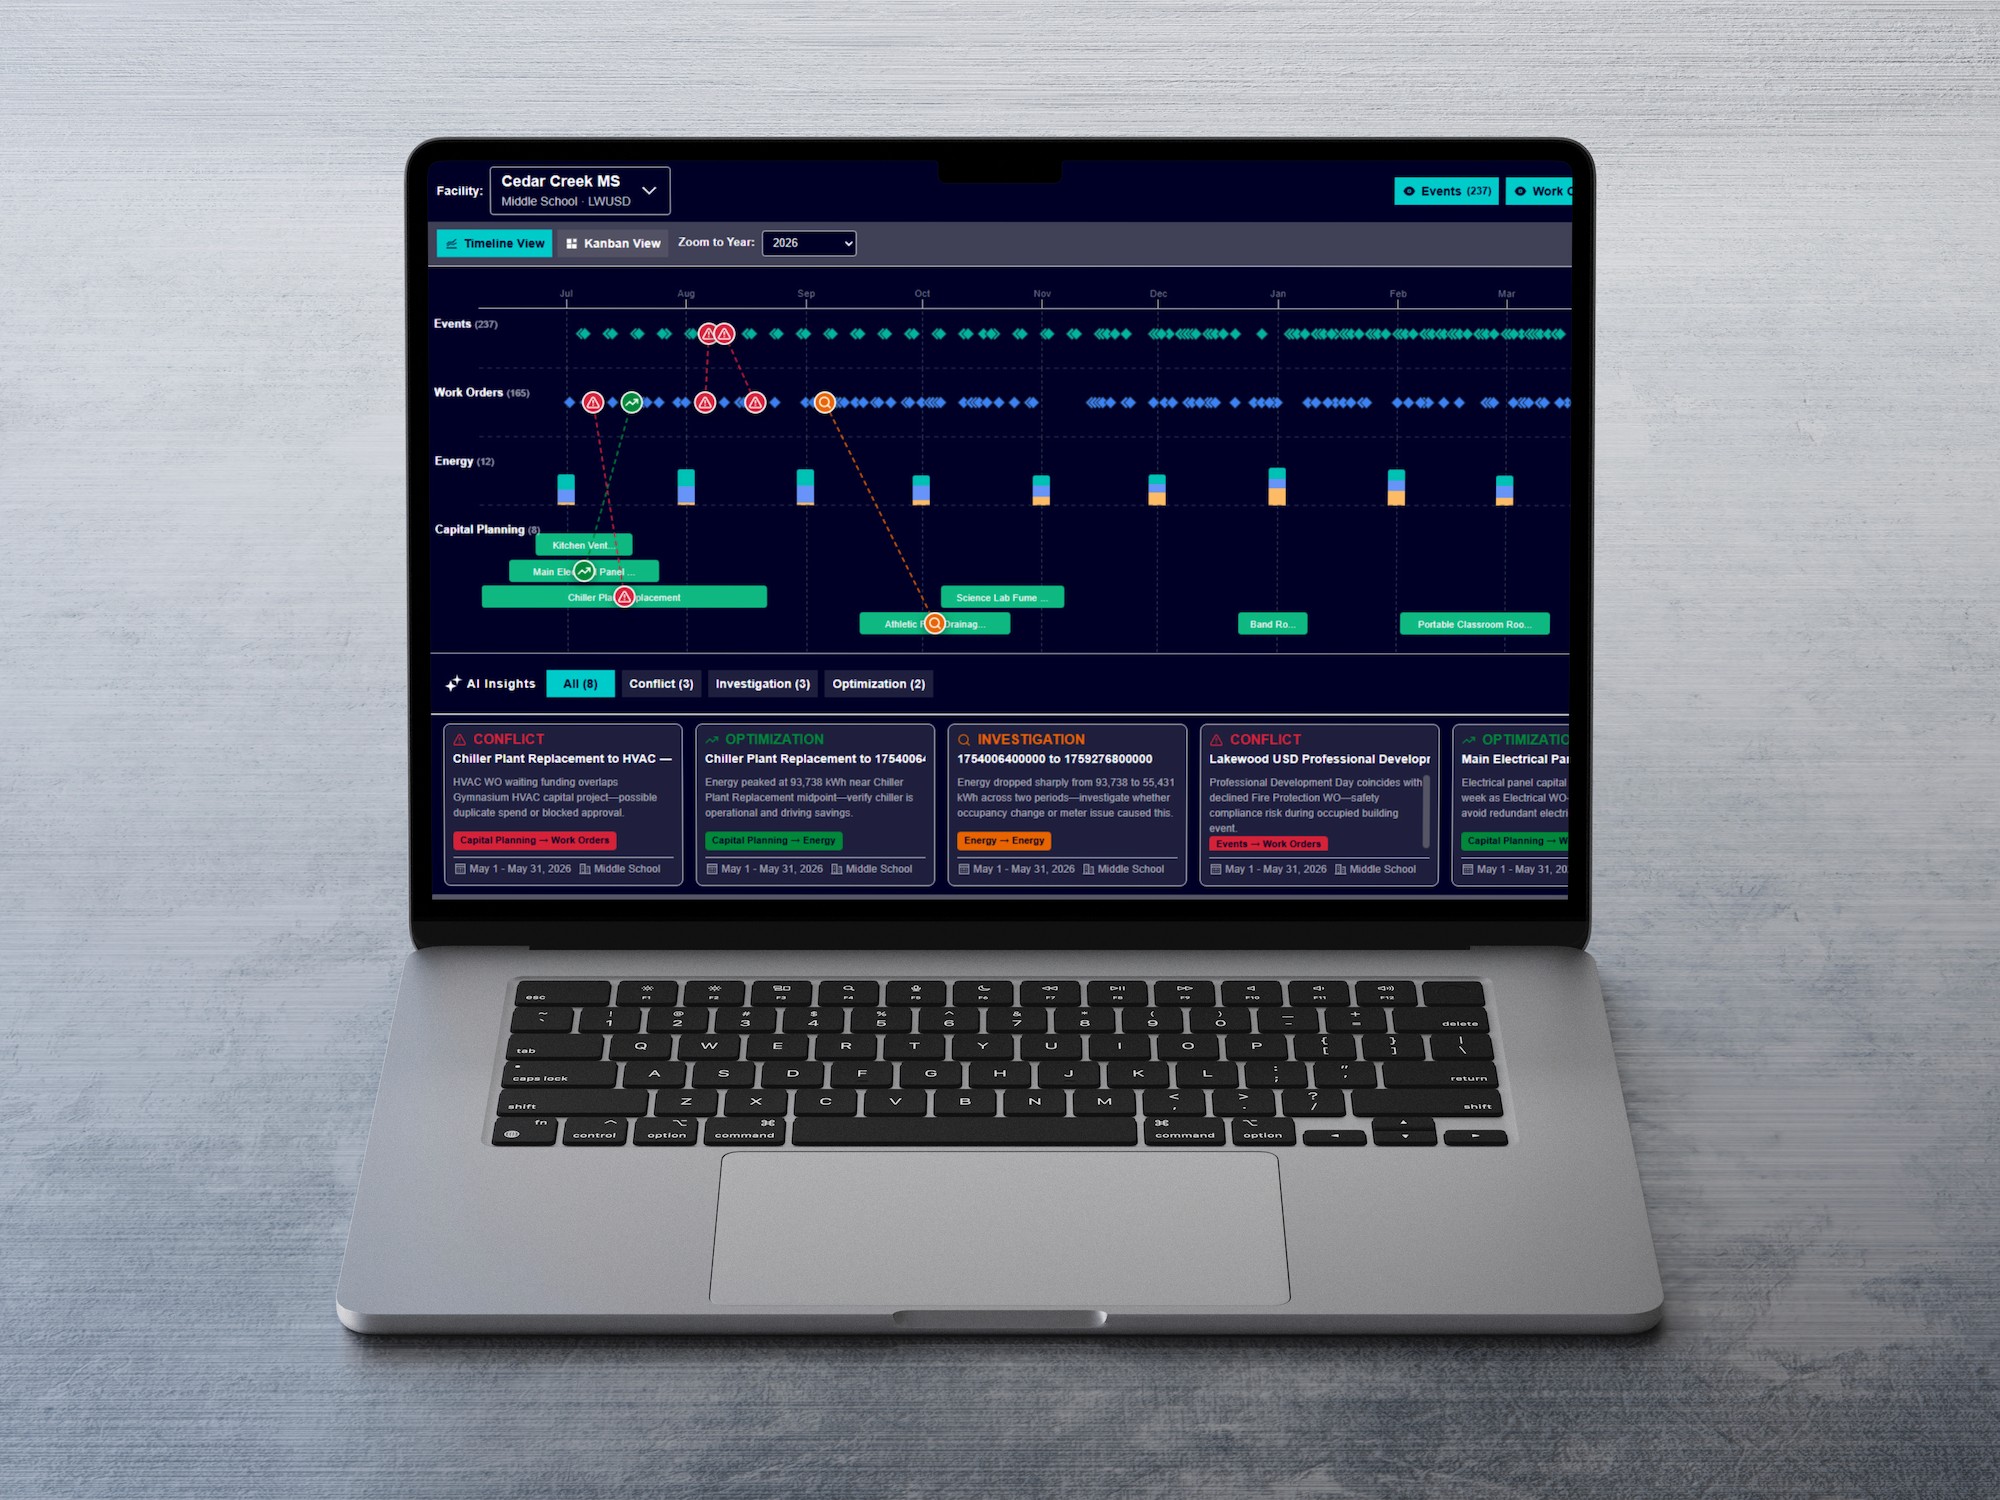
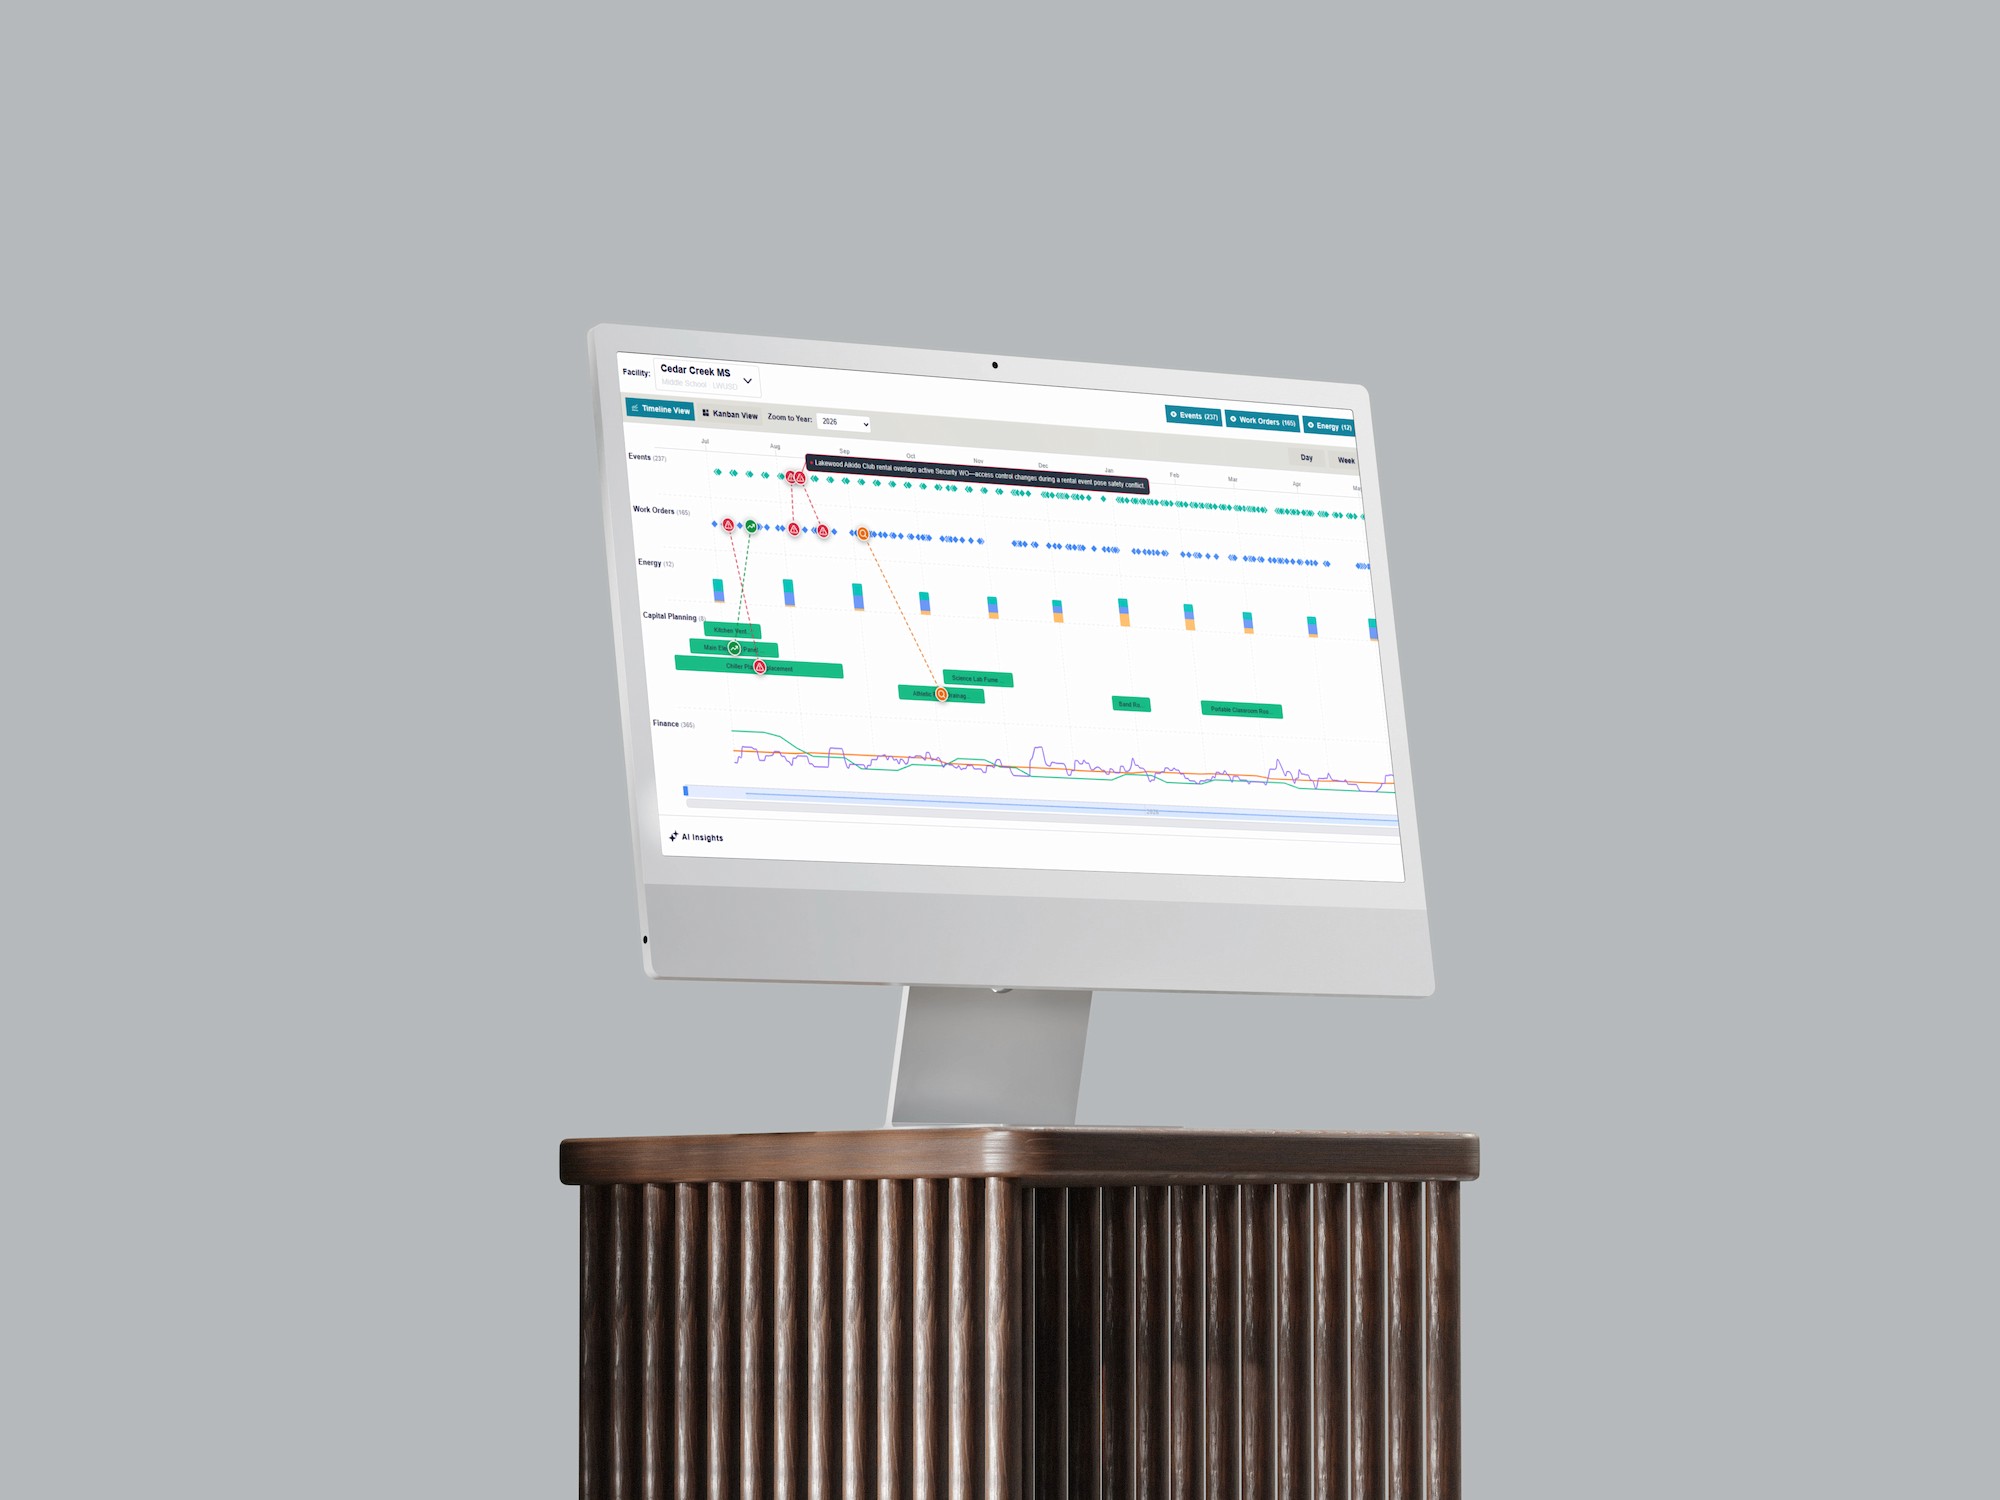
As I considered this problem, a connection point across our facility management products came into view: everything had a relationship with time. Events, work orders, planned maintenance, capital planning, and expenses could all be plotted on a timeline. After refining the concept and creating a prompt with Siemens GPT, I moved into Figma Make to build out the prototype.
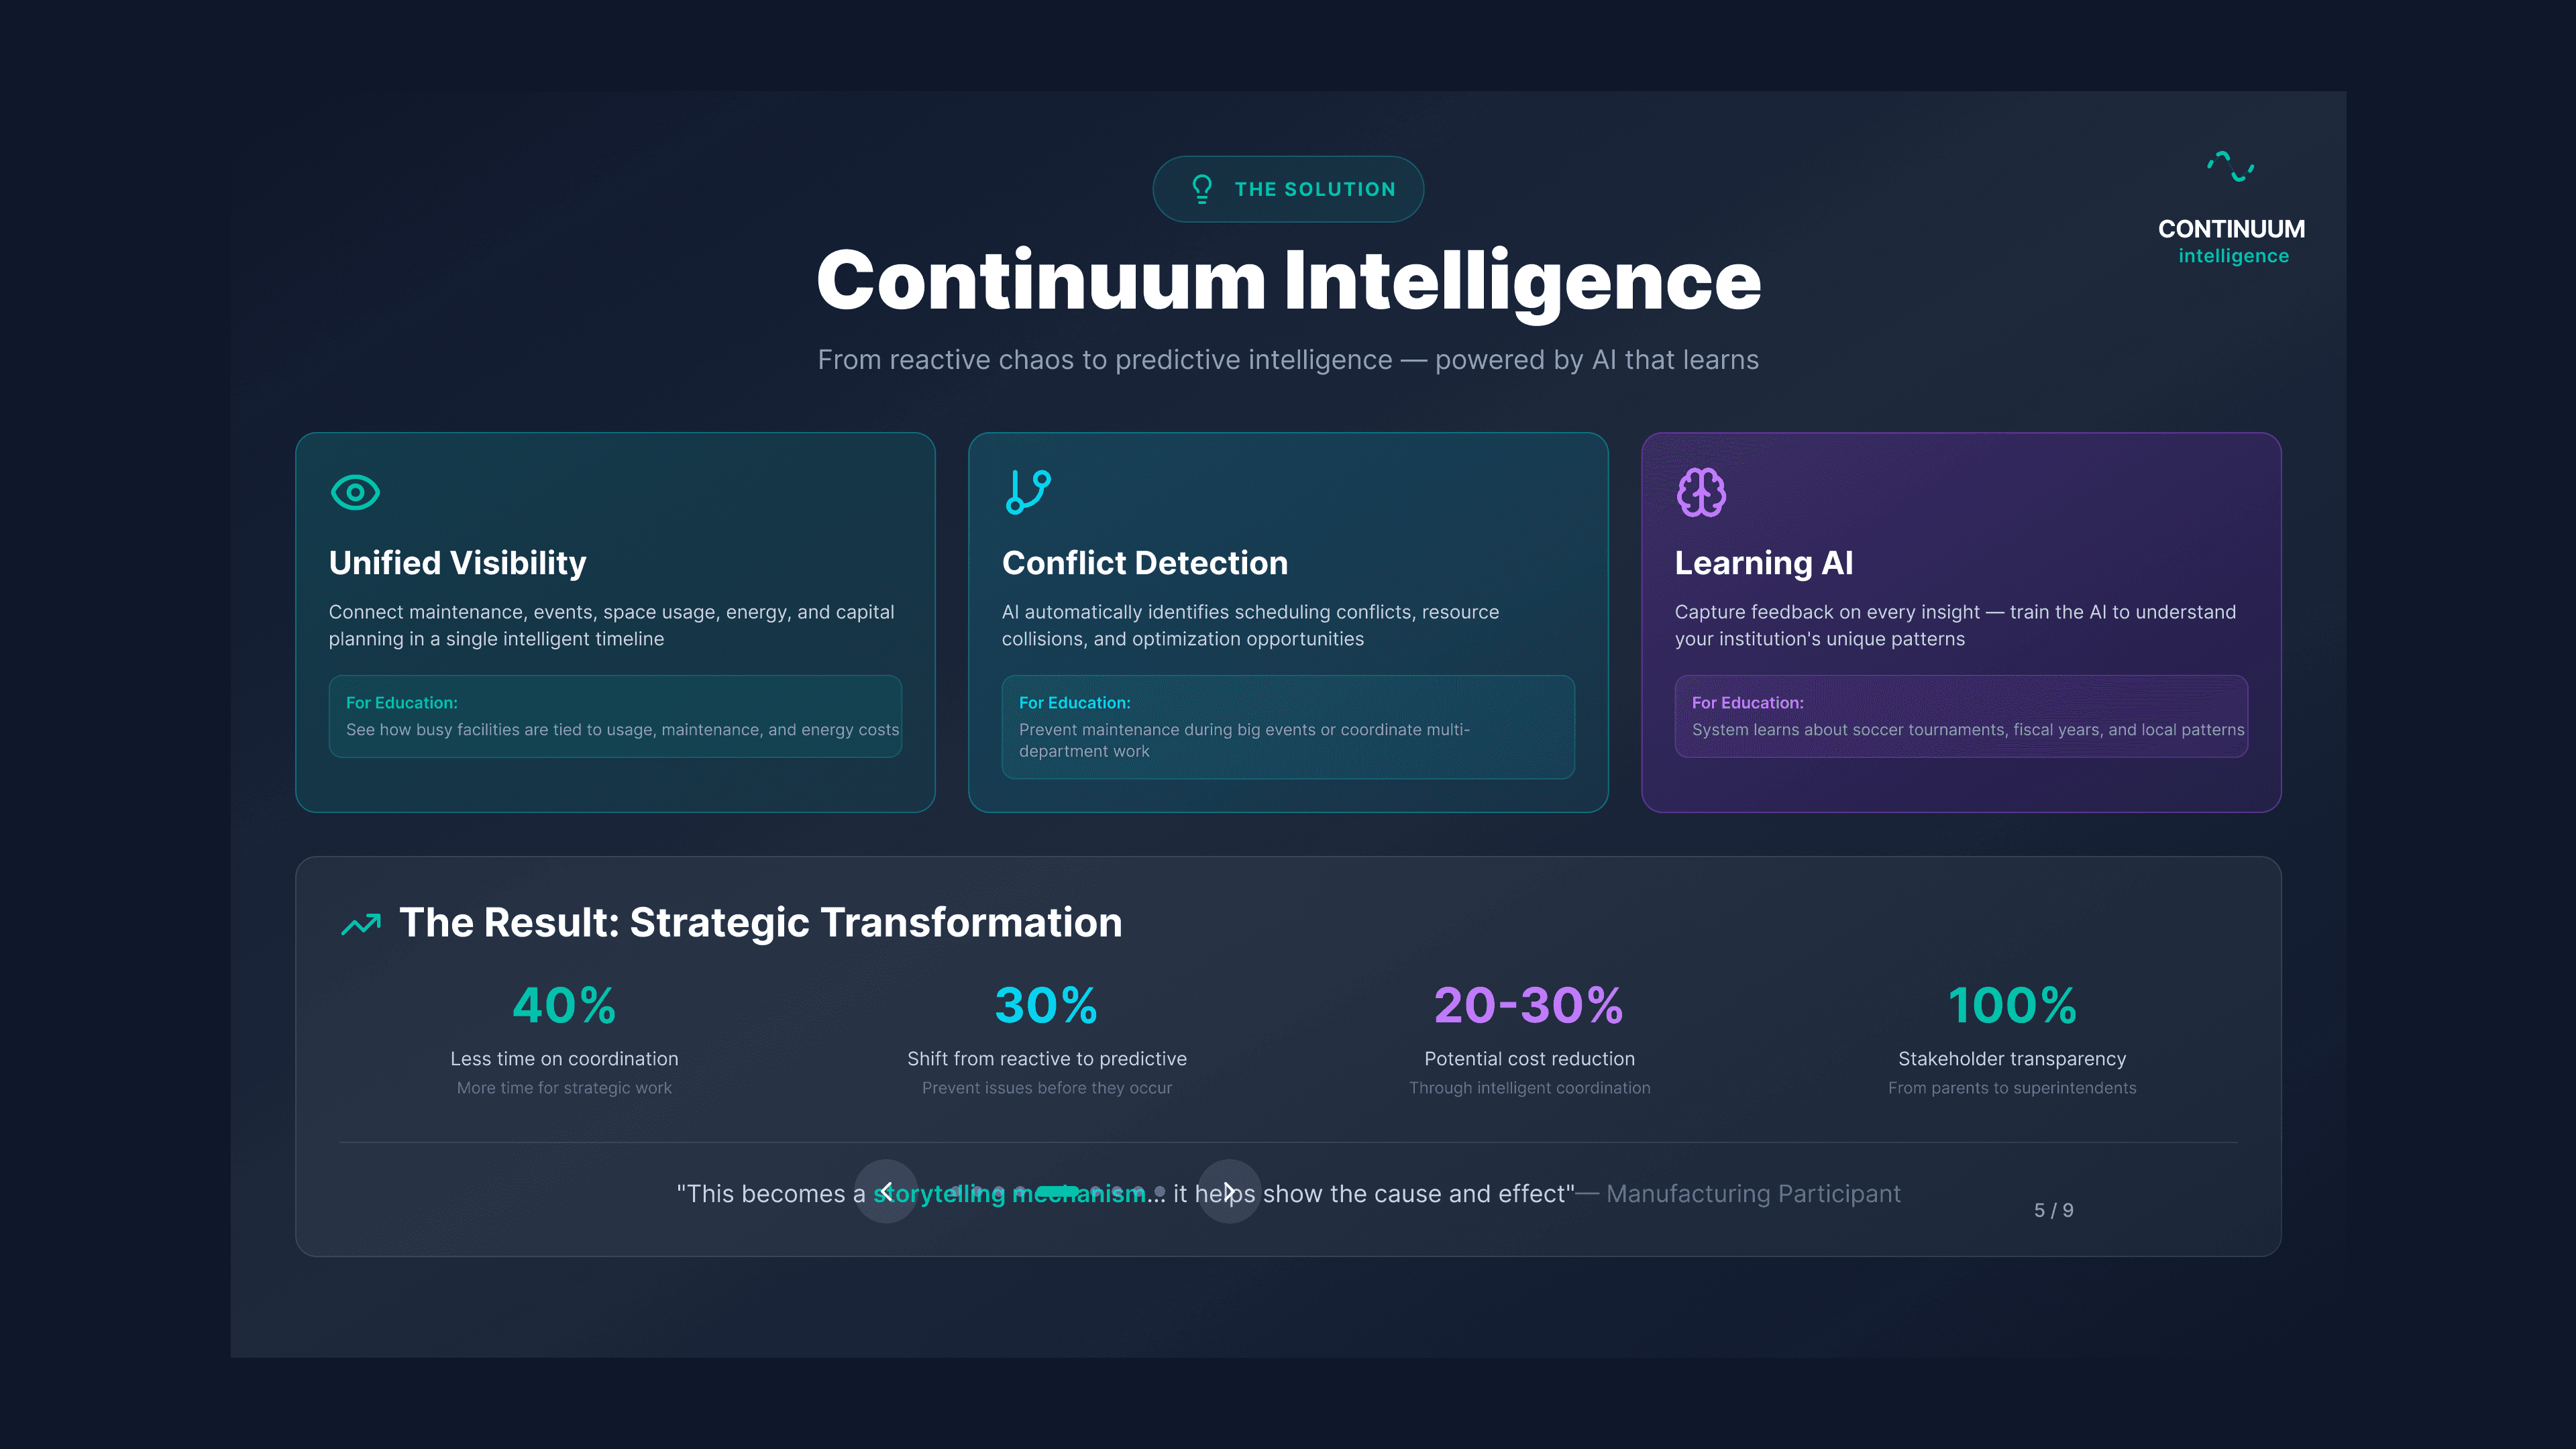
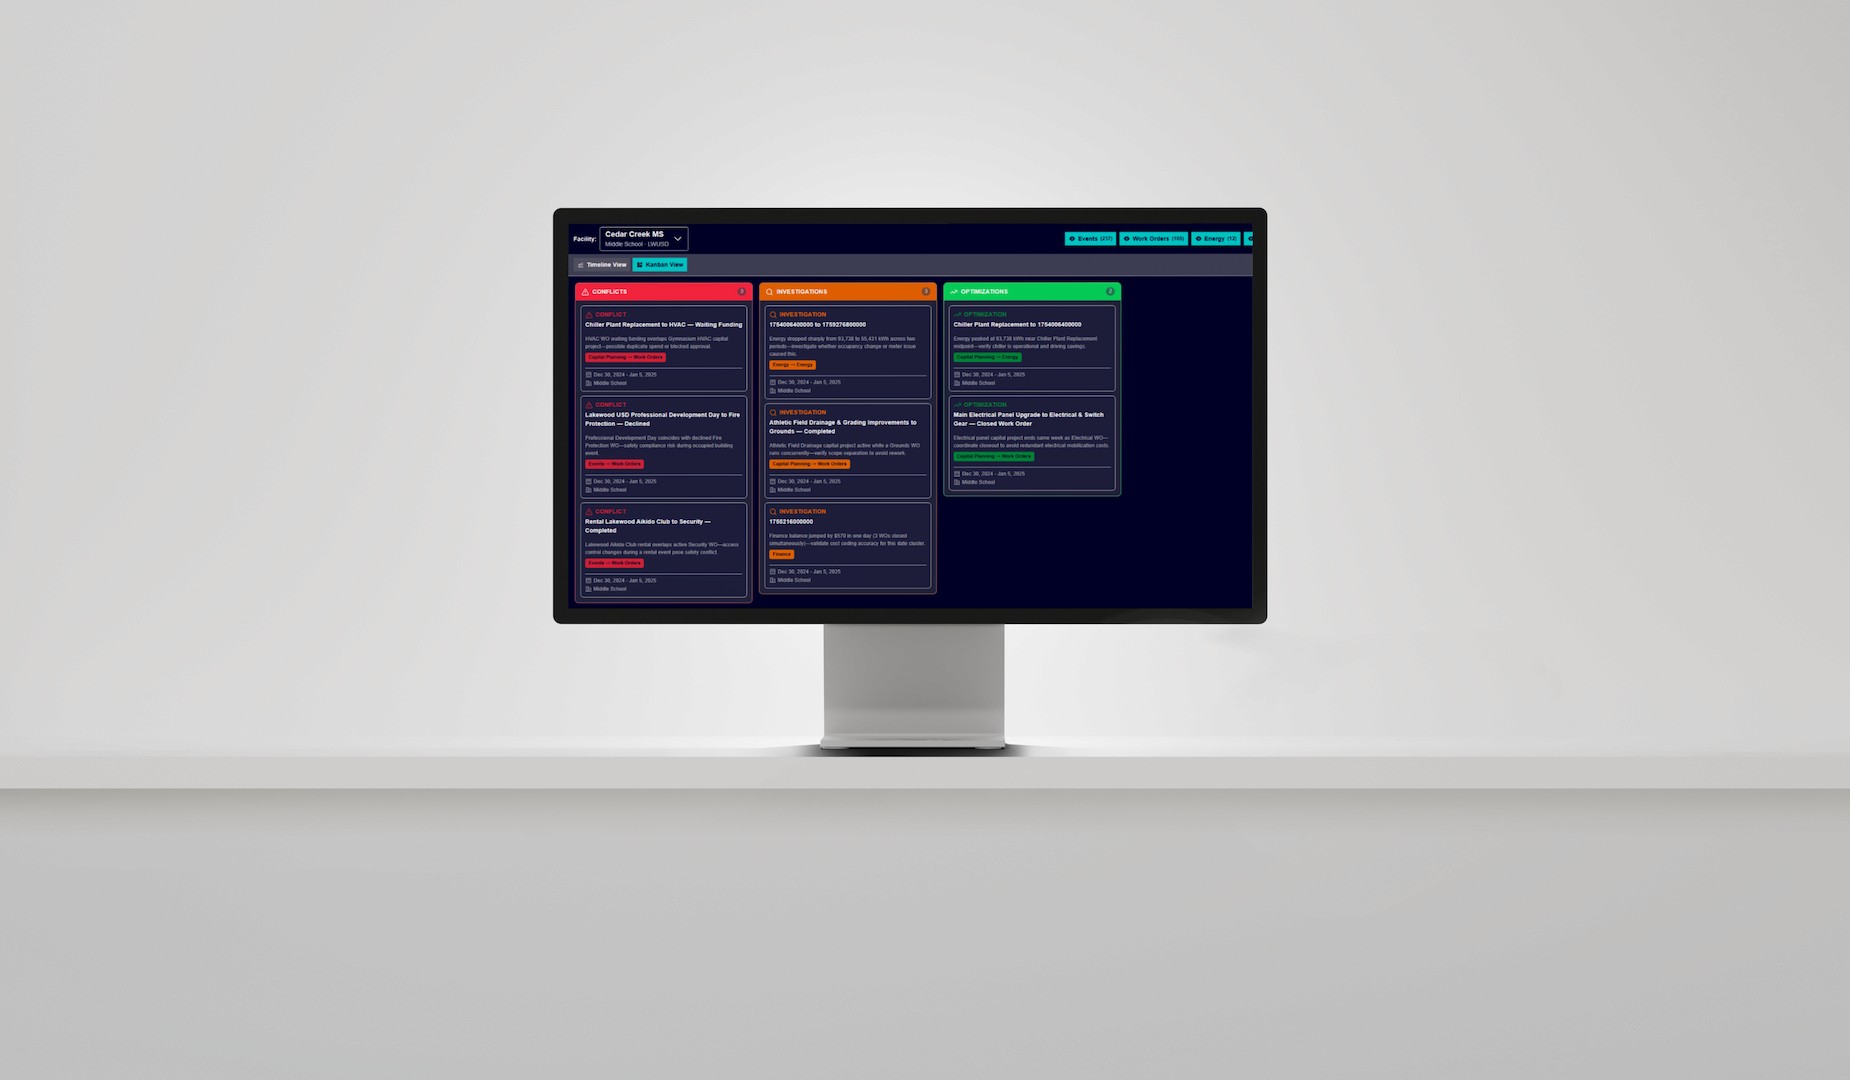
The result was Continuum Intelligence that maps data from across products into swim lanes, draws connections between them, and surfaces opportunities to optimize, investigate cause and effect, and prevent conflicts before they happen.
What We Built
The Power of AI
Detailed Insights
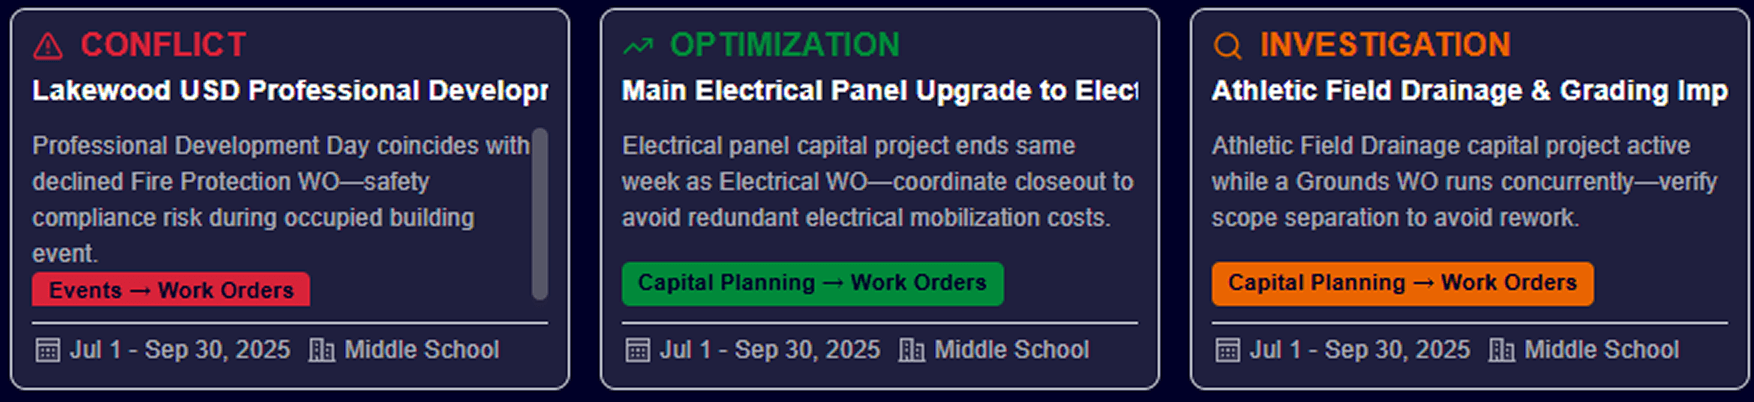
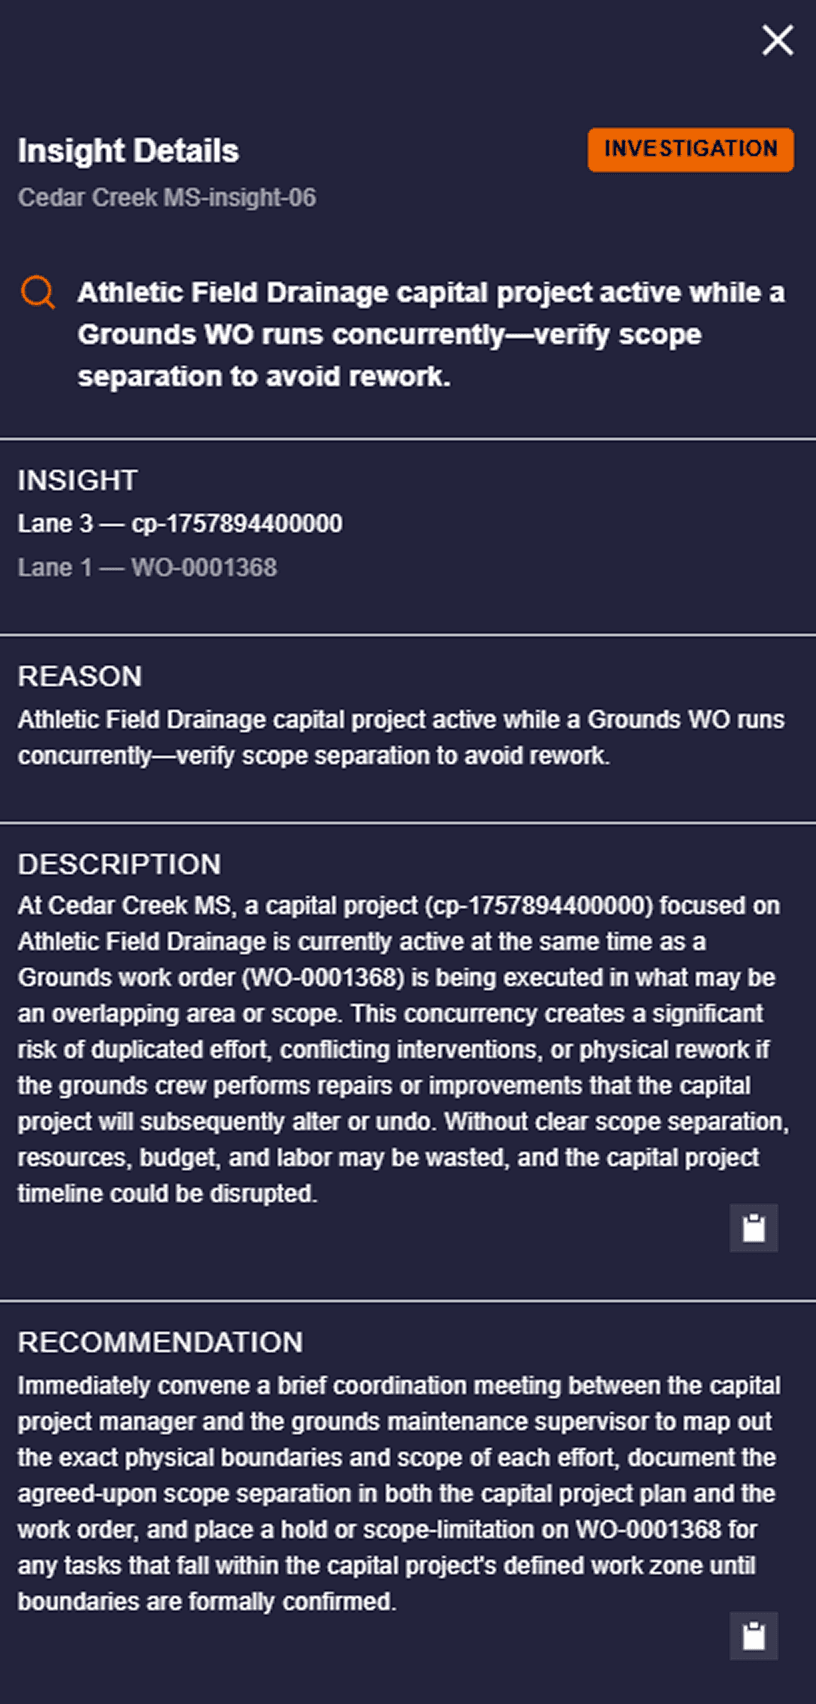
Agents don't just flag issues, they explain them. Each finding comes with a reason, a detailed description, and recommended actions.
Ask Even More
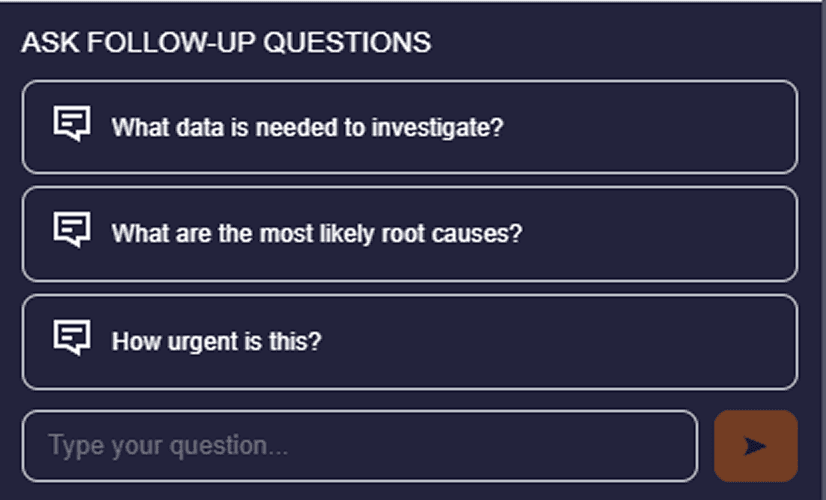
And if you want to dig deeper, you can interact with the agents directly through prescripted questions or a simple chat interface.